My Role & Skills
About
Researcher
Red Routes, Cognitive Walkthrough, Heursitic Analysis, HTA & SHERPA, Usability Testing, SUS Scale, NASA TLX, Synthesis
Duration
2 Weeks, January 2018
The team
This usability analysis was performed to understand the different methodologies that can be used in Auditing a product. This mix of qualitative and quantitative data allowed for a generation of a strong set of recommendations at each stage to improve wayfinding and accessibility for the Coursera application. Coursera is an American online learning platform that offers massive online open courses(MOOC), specializations, and degrees. Coursera works with universities and other organizations to offer online courses, specializations, and degrees in a variety of subjects that last approximately four to ten weeks, with one to two hours of video lectures a week.
Myself - Researcher
Methodology
INSPECTION METHODS
By Designers and Experts
01
02
03
04
Red Routes
Categorise functions of the product on the basis of their usage and importance
Cognitive
Walkthrough
Evaluate usability
Heuristic Analysis
Identify most common usability issues in the interface and product features
Hierarchical
Task Analysis
Understand possible pathways to achieve goals
05
SHERPA
Understand potential errors that users may make, and propose corrective measures
EMPIRICAL METHODS
Testing with Expert and Novice users
01
02
03
Usability matrix
- Effectiveness
- Efficiency
Analysing usability with set of expert and novice users
System Usability
Scale
Understand the rating that users assign their experience with the app
NASA TLX
Evaluate the task load that users face in navigating the app

First, some inspections
This was important to familiarize myself with the app and its core functions before taking it to the users. Pre-defined heuristics acted as a starting point for identifying potential problems areas and sections that needed to be tested with the users.

WHAT TASKS WOULD APP USERS DO THE MOST?
Red Routes
Red routes are the critical tasks that deliver the most value to your users. These routes are the foundational user journeys that make the application valuable and typically capture 90% or more of your user’s actions. Red routes was used as a preliminary step to map the critical and frequent paths that users take to complete their tasks.
01

02
WHAT TASKS AND FUNCTIONS CAN USERS LEARN TO DO QUICKLY? WHICH ONES LESS SO?
Cognitive Walkthrough
A cognitive walkthrough was used to examine the usability of specific functions of the app and check how easily users can carry out tasks. It is based on the idea that if given a choice – most users prefer to do things to learn a product rather than to read a manual or follow a set of instructions.


WHICH FACETS OF THE APP'S USABILITY REQUIRE ATTENTION?
Heuristic Analysis
03
This usability engineering method was used to find usability problems in the user interface design based on the 10 Nielsen Heuristics. Heuristics that would need to be prioritized were categorized based on number of issues and their estimated impact.

USER CONTROL & FREEDOM
-
Inability to dismiss dialogue boxes by tapping outside.
-
Core sections of the app cannot be accessed without signing up.
-
Deadline reset cannot be reversed.
-
Lack of system interactions by swiping, gesturing, or pinching instead of only touching the elements

ERROR PREVENTION
-
Users cannot undo an accidental click.
-
Missing example inputs for format-specific or complex information.
-
Ambiguous prompts and briefs.
-
Lack of signals on error elements in a form, and marks on elements to be changed for data entry screens.

HELP & DOCUMENTATION
-
Instruction are not simple and clear
-
Not easy to search for help.
-
All help documentation is not focused on the user’s tasks.
-
Users are not presented with other instant channels of communication for assistance to reach their goal.

VISIBILITY OF SYSTEM STATUS
-
Lack of plash screens that show system status.
-
Ambiguous visual feedback in menus or dialog boxes about which choices are selectable.
-
Lack of feedback during the sign-up process.

CONSISTENCY & STANDARDS
-
Lack of adaptability of system font appearance (size, typeface) to match operating system font appearance.
-
Inconsistent location of menu across the system.
-
Inability to save partially filled screens and data fields.

04
PRIMARY TASKS
Logging in
Accessing a course
Identifying free courses
Downloading content
Accessing downloads
Logging out
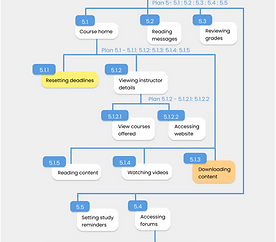
HOW IS THE APP STRUCTURED?
WHAT PATHWAYS WOULD A USER TAKE FOR EACH CORE TASK?
WHICH STEPS SHOW ERROR CRITICALITY BASED ON CURRENT INSIGHTS?
SECONDARY TASKS
Accessing help centre
Logging out
Setting reminders
Syncing calendar
Hierarchical Task Analysis & SHERPA
The primary focus while performing HTA was to evaluate the most basic tasks a novice or even expert users would perform on the app. Each task was separately analyzed for errors, and an error code was assigned, and potential consequences were identified. After that, criticalities were identified to find the errors to tackle first and list solutions.


WHAT OTHER APPLICATION ELEMENTS POSE A PROBLEM?
Observations
05
Red routes are the critical tasks that deliver the most value to your users. These routes are the foundational user journeys that make the application valuable and typically capture 90% or more of your user’s actions. Red routes was used as a preliminary step to map the critical and frequent paths that users take to complete their tasks.


Now, to the users.
The Coursera app was tested with a total of 27 users - 12 experts, who regularly used the app, and 15 novices, who were using the app for the first time. While the observational insights could be gained with as low a number as 5 users, the extensive testing was done to get better statistical data.

HOW QUICKLY AND ACCURATELY ARE USERS ABLE TO COMPLETE THEIR TASKS?
Usability Matrix
01
Effectiveness & Time based efficiency
EFFECTIVENESS
The accuracy and completeness with which users achieve specified goals
EFFICIENCY
The resources expended in relation to the accuracy and completeness with which users achieve goals


0.0563619 goals/sec
EXPERT USERS
0.0640129 goals/sec
NOVICE
Insights

01
Login time varies primarily due to users’ proficiency with the process.
03
Finding a course to study a subject also varies since the users have to complete the task through trial and error.
05
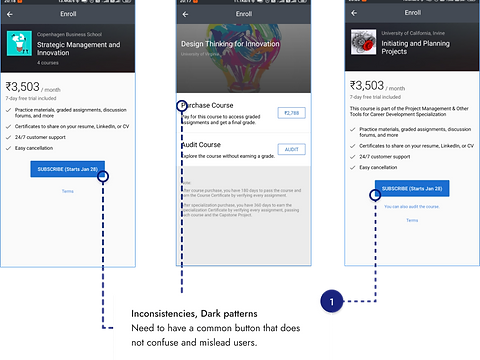
Distinction between free to audit, specialization courses, paid courses, 7 day free trial is not visible at search stage.
02
User times for finding a free course varies based on luck, since finding a free course is almost always based on trial and error method.
04
Unenroll button is only accessible through the home page, and does not have an easily identifiable pathway.
06
Coursera for Government is a specific tab available only through one specific pathway and found in the footer.
02
HOW DID THE USERS RESPOND TO USING THE APP?
System Usability Scale
System Usability Scale consists of a 10 item questionnaire with five response options for respondents; from Strongly agree to Strongly disagree.


Insights

01
SUS scores vary across a wide range for expert users, with scores lying between 21 and 100.
02
The novice users show more consistency, with scores lying in the 41-50 range (7/15 users), indicating that they found the application to be average.
03
Many expert users rated the app lower since they had previously used only a few features, and were not aware of tested features that were harder to access.

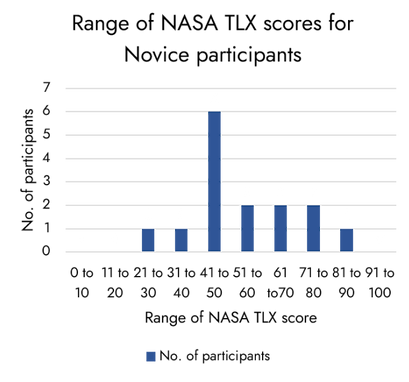
WHAT TASK LOAD DID USERS REPORT FOR THEIR EXPERIENCE WITH THE APP?
NASA TLX
The NASA Task Load Index (NASA-TLX) is a widely used, subjective, multidimensional assessment tool that rates perceived workload in order to assess a task, system, or team's effectiveness or other aspects of performance.
03


Insights
01
The NASA TLX score for expert users lies mainly in the 51-60 and neighbouring ranges, indicating average task load.
02
This number is lower for novice users where the highest number of participants lie in the 41-50 range.
03
There were certain habitual pathways that confused the experts. Novices faced less task load, implying that the app has fairly good learnability for a new user.
What next?
Which insights to prioritize?
-
Findings from each stage of analysis provide actionable next steps.
-
The findings from the 5 heuristics show an appropriate hierarchy of problems to tackle.
-
Using the insights from each screen, consistency in the interface elements can be brought about easily.
-
Pathways for help and documentation need to be simplified for new users.
-
Secondary features of the application could eventually be made more evident to users.
Up Next

B2C / Consumer Experience / Delighters
© 2023 Malavika Vijayan. All Rights Reserved.
Made with love, Figma and many Vanilla Lattes
Write to me on @v.malavika297@gmail.com if something caught your eye. Always open to chat!